Data Visualization
27 Sep 2021Reporting
- The process of organizing data into informational summaries to monitor how different areas of an organization are performing.
Business Intelligence (BI)
- Technologies, applications, and practices for the collection, integration, analysis, and presentation of business information.
- The purpose of business intelligence is to support better decision making.
- This process of comparison with other companies in the same industry is known as benchmarking.
Data Vizualization
- Data visualization is the graphical representation of information and data.
- Power BI -> can connect to multiple different sources of data, and combine them into a data model.
Visualization options to represent data
- Bar and column charts
- Line charts
- Matrix
- Key influencers
- Treemap
- Dot plot chart or Bubble chart or scatter chart -> along X-axis
- Filled map
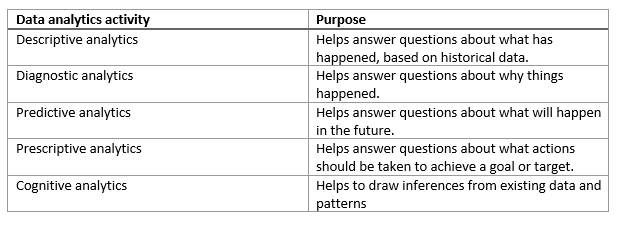
Data analytics
