Python Introduction
16 Nov 2021Building with Power BI
30 Sep 2021Microsoft Power BI
- A collection of software services, apps, and connectors that work together to turn your unrelated sources of data into coherent, visually immersive, and interactive insights.
- Power BI -> connect to data sources, visualize (or discover) what’s important, and share.
The parts of Power BI
- Microsoft Windows desktop application called Power BI Desktop, an online SaaS (Software as a Service) service called the Power BI service.
- Mobile Power BI apps that are available on any device.
- With native mobile BI apps for Windows, iOS, and Android.
Flow of work in Power BI
- Power BI Desktop -> report is created -> report is then published -> Power BI service ->shared using -> Power BI Mobile apps
Building blocks of Power BI
- Basic building blocks in Power BI:
- Visualizations
- Datasets
- Reports
- Dashboards
- Tiles
Visualizations
- A visual representation of data, like a chart, a color-coded map, or other interesting things you can create to represent your data visually.
Datasets
- A collection of data that Power BI uses to create its visualizations.
- A combination of many different sources, which you can filter and combine to provide a unique collection of data (a dataset) for use in Power BI.
- The multitude of data connectors that are included.
Reports
- A report is a collection of visualizations that appear together on one or more pages.
Dashboards
- To share a report, or a collection of visualizations, you create a dashboard.
- a Power BI dashboard is a collection of visuals from a single page that you can share with others.
- A dashboard must fit on a single page, often called a canvas.
Tiles
- A tile is a single visualization on a dashboard.
- creating a dashboard in Power BI -> move or arrange tiles however you want.
- viewing, or consuming a dashboard or report -> you’re not the creator or owner(cannot change but interact only)
App
- An app is a collection of preset, ready-made visuals and reports that are shared with an entire organization.
Create out-of-box dashboards with cloud services
Click Get Data -> Canvas -> connect to software services like Salesforce, Facebook, Google Analytics etc -> Power BI service provides a collection of ready-made visuals that are pre-arranged on dashboards and reports for your organization called app ->Connect to Github -> Dashboard, Report, Dataset(collection of Data) -> Pull Request ->Update the dataset ->Scheduled Refresh ( in Settings)
Data Ingestion, Storage and Processing in Azure
29 Sep 2021Common Practices For Data Loading
- In a big data system, data ingestion has to be fast enough to capture the large quantities of data that may be heading your way, and have enough compute power to process this data in a timely manner.
- More popular tools used with Azure:
- Azure Data Factory
- PolyBase
- SQL Server Integration Services
- Azure Databricks.
1.Azure Data Factory
- Azure Data Factory is a data ingestion and transformation service that allows you to load raw data from many different sources, both on-premises and in the cloud.
- Clean, transform, and restructure the data, before loading it into a repository such as a data warehouse.
- Contains a series of interconnected systems that provide a complete end-to-end platform for data engineers.
- Can load static data, but you can also ingest streaming data.
- Data Factory provides an orchestration engine.
- Orchestration is the process of directing and controlling other services, and connecting them together, to allow data to flow between them.
- Azure Data Factory uses a number of different resources: linked services, datasets, and pipelines.
- Used to ingest data into Azure Synapse Analytics
Linked Services
- Data Factory moves data from a data source to a destination.
- A linked service provides the information needed for Data Factory to connect to a source or destination.
Datasets
- A dataset in Azure Data Factory represents the data that you want to ingest (input) or store (output).
- A dataset connects to an input or an output using a linked service.
Pipelines
- A pipeline is a logical grouping of activities that together perform a task.
- The activities in a pipeline define actions to perform on your data.
- Use a copy activity to transform data from a source dataset to a destination dataset.
- Azure Function activity to run an Azure Function to modify and filter data.
- Azure Databricks Notebook activity to run a notebook that performs more advanced processing.
- Pipelines don’t have to be linear.
- logic activities that repeatedly perform a series of tasks while some condition is true using a ForEach activity.
- Follow different processing paths depending on the outcome of previous processing using an If Condition activity.
- You can run a pipeline manually, or you can arrange for it to be run later using a trigger.
- A trigger enables you to schedule a pipeline to occur according to a planned schedule.
2. PolyBase
- PolyBase is a feature of SQL Server and Azure Synapse Analytics that enables you to run Transact-SQL queries that read data from external data sources.
- PolyBase, you can read data managed by Hadoop, Spark, and Azure Blob Storage, as well as other database management systems such as Cosmos DB, Oracle, Teradata, and MongoDB.
- Spark is a parallel-processing engine that supports large-scale analytics.
- Run queries that join tables in a SQL database with external data, enabling you to perform analytics that span multiple data stores.
- Azure SQL Database does not support PolyBase.
3. SQL Server Integration Services
- Building enterprise-level data integration and data transformations solutions.
- SSIS is part of Microsoft SQL Server.
- SSIS can extract and transform data -> XML data files, flat files, and relational data sources, and then load the data into one or more destinations
- A rich set of built-in tasks and transformations, graphical tools for building packages, and the Integration Services Catalog database, where you store, run, and manage packages.
- SSIS is an on-premises utility.
- Azure Data factory allows you to run your existing SSIS packages as part of a pipeline in the cloud ->started quickly without rewrite your existing transformation logic.
4. Azure Databricks
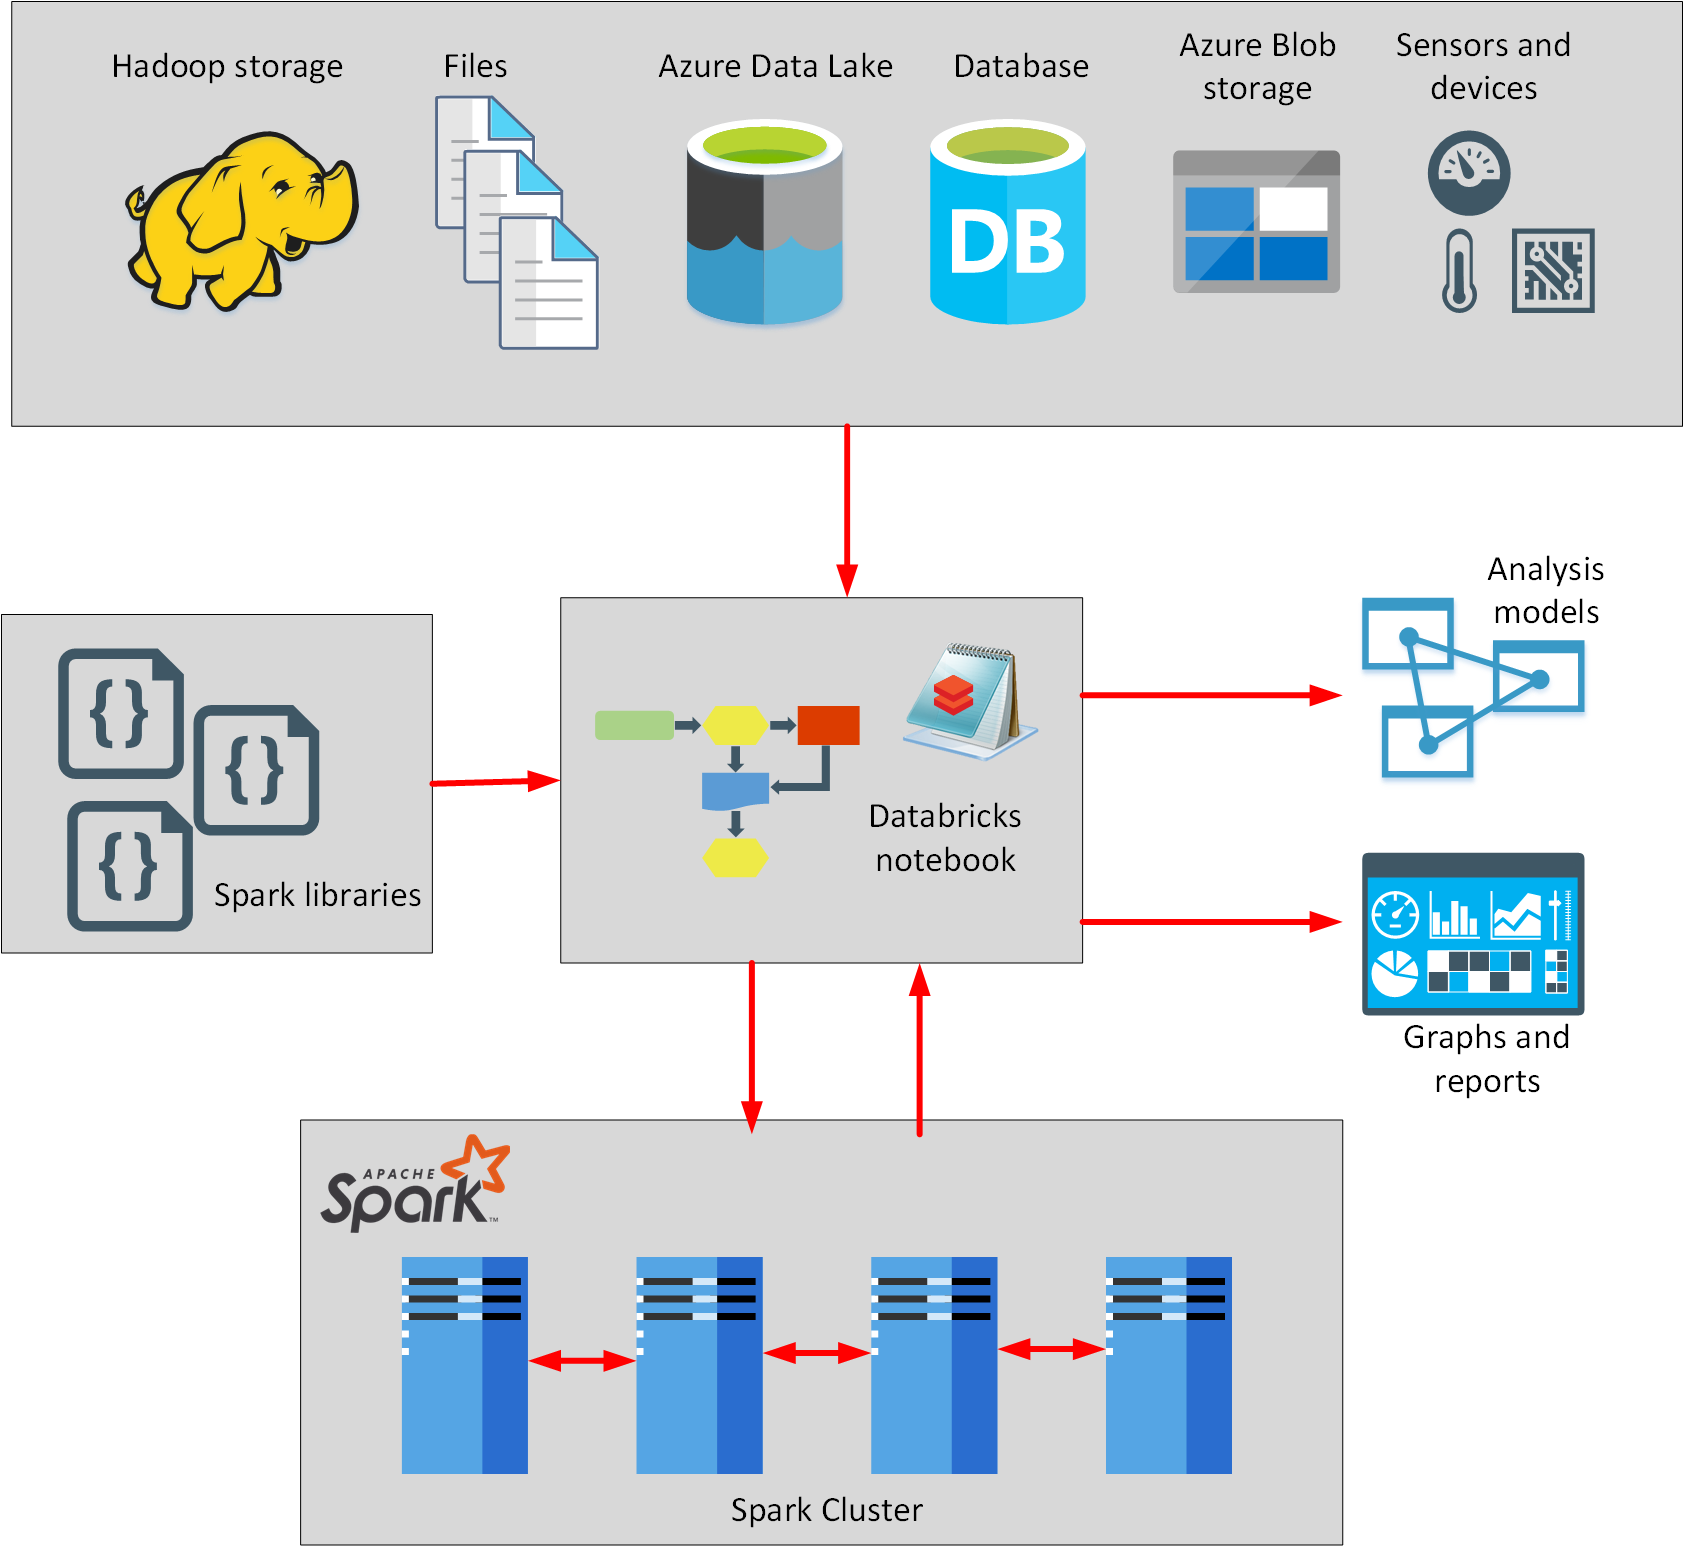
- Databricks is based on Spark, and is integrated with Azure to streamline workflows.
- Databricks can process data held in many different types of storage, including Azure Blob storage, Azure Data Lake Store, Hadoop storage, flat files, SQL databases, and data warehouses, and Azure services such as Cosmos DB.
- write and run Spark code using notebooks.
- A notebook is like a program that contains a series of steps (called cells). A notebook can contain cells that read data from one or more data sources, process the data, and write the results out to a data store.
- The scalability of Azure Databricks makes it an ideal platform for performing complex data ingestion and analytics tasks.
- Azure Data Factory can incorporate Azure Databricks notebooks into a pipeline.
5. Azure Synapse Analytics
Data storage and processing in Azure
Azure Synapse Analytics
- Azure Synapse Analytics is to extract the data from where it’s currently stored, load this data into an analytical data store, and then transform the data, shaping it for analysis. This approach is known as ELT, for extract, load, and transform.
- Using Apache Spark, and automated pipelines -> it run parallel processing tasks across massive datasets, and perform big data analytics.
- Big data refers to data that is too large or complex for traditional database systems. Systems that process big data have to perform rapid data ingestion and processing; they must have capacity to store the results, and sufficient compute power to perform analytics over these results.
- Analyze operational data in its original location -> hybrid transactional analytical processing (HTAP) ->Perform analysis over data held in repositories such as Azure Cosmos DB using Azure Synapse Link.
- Processing data in Azure:
- Azure Databricks
- Azure Data Factory
- Azure Synapse Analytics
- Azure Data Lake.
- Azure Synapse Analytics is a generalized analytics service ->read data from many sources, process this data, generate various analyses and models, and save the results.
- Two technologies to process data:
- T-SQl
- Spark
Azure Databricks
- A driver is a piece of code that connects to a specific data source and enables you to read and write that source.
- A driver -> part of a library that you can load into the Databricks environment.
- Drivers are available -> Azure SQL Database, Azure Cosmos DB, Azure Blob storage, and Azure Data Lake storage, third-parties (such as MySQL and PostgreSQL).
- Processing engine is provided by Apache Spark.
- Spark is a parallel-processing engine that supports large-scale analytics.
- Spark application code in Python, R, Scala, Java, and SQL.
- Libraries include modules for machine learning, statistical analysis, linear and non-linear modeling, predictive analytics, and graphics.
- Databricks applications using a Notebook -> steps called cells
- In-memory model to a repository. The first line in the cell is %language. For example, %scala.
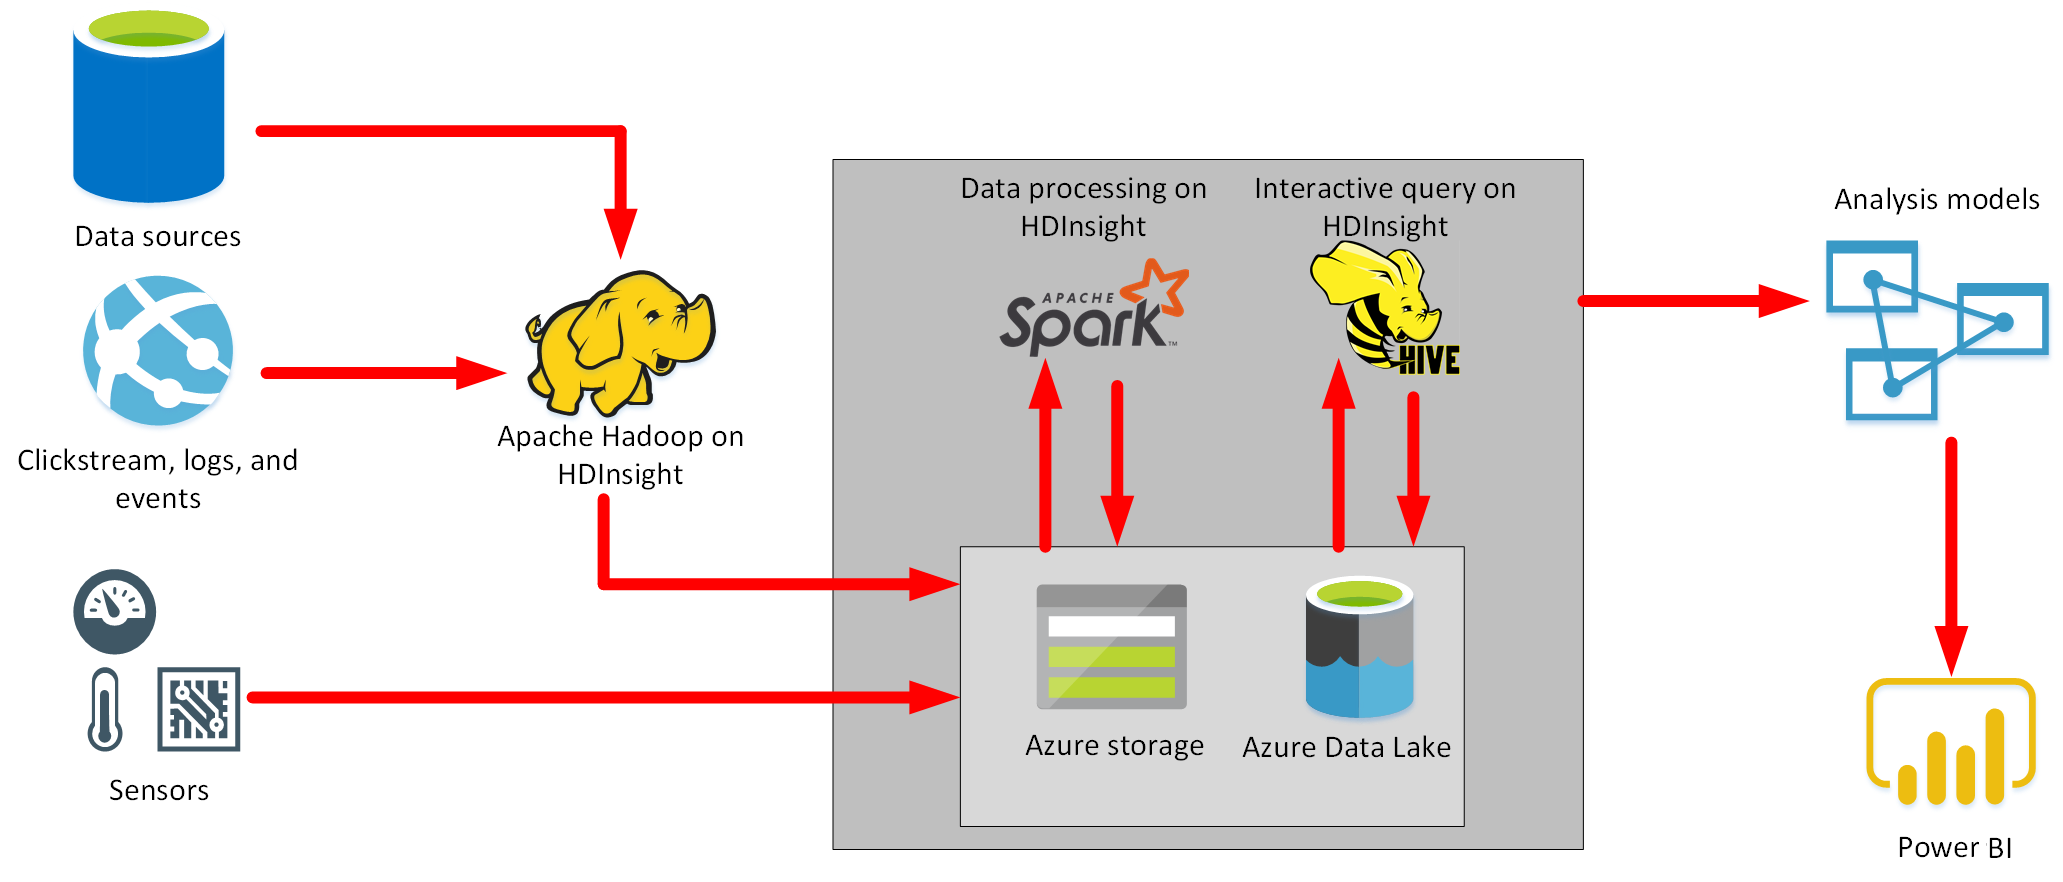
Azure HDInsight
- Managed analytics service in the cloud.
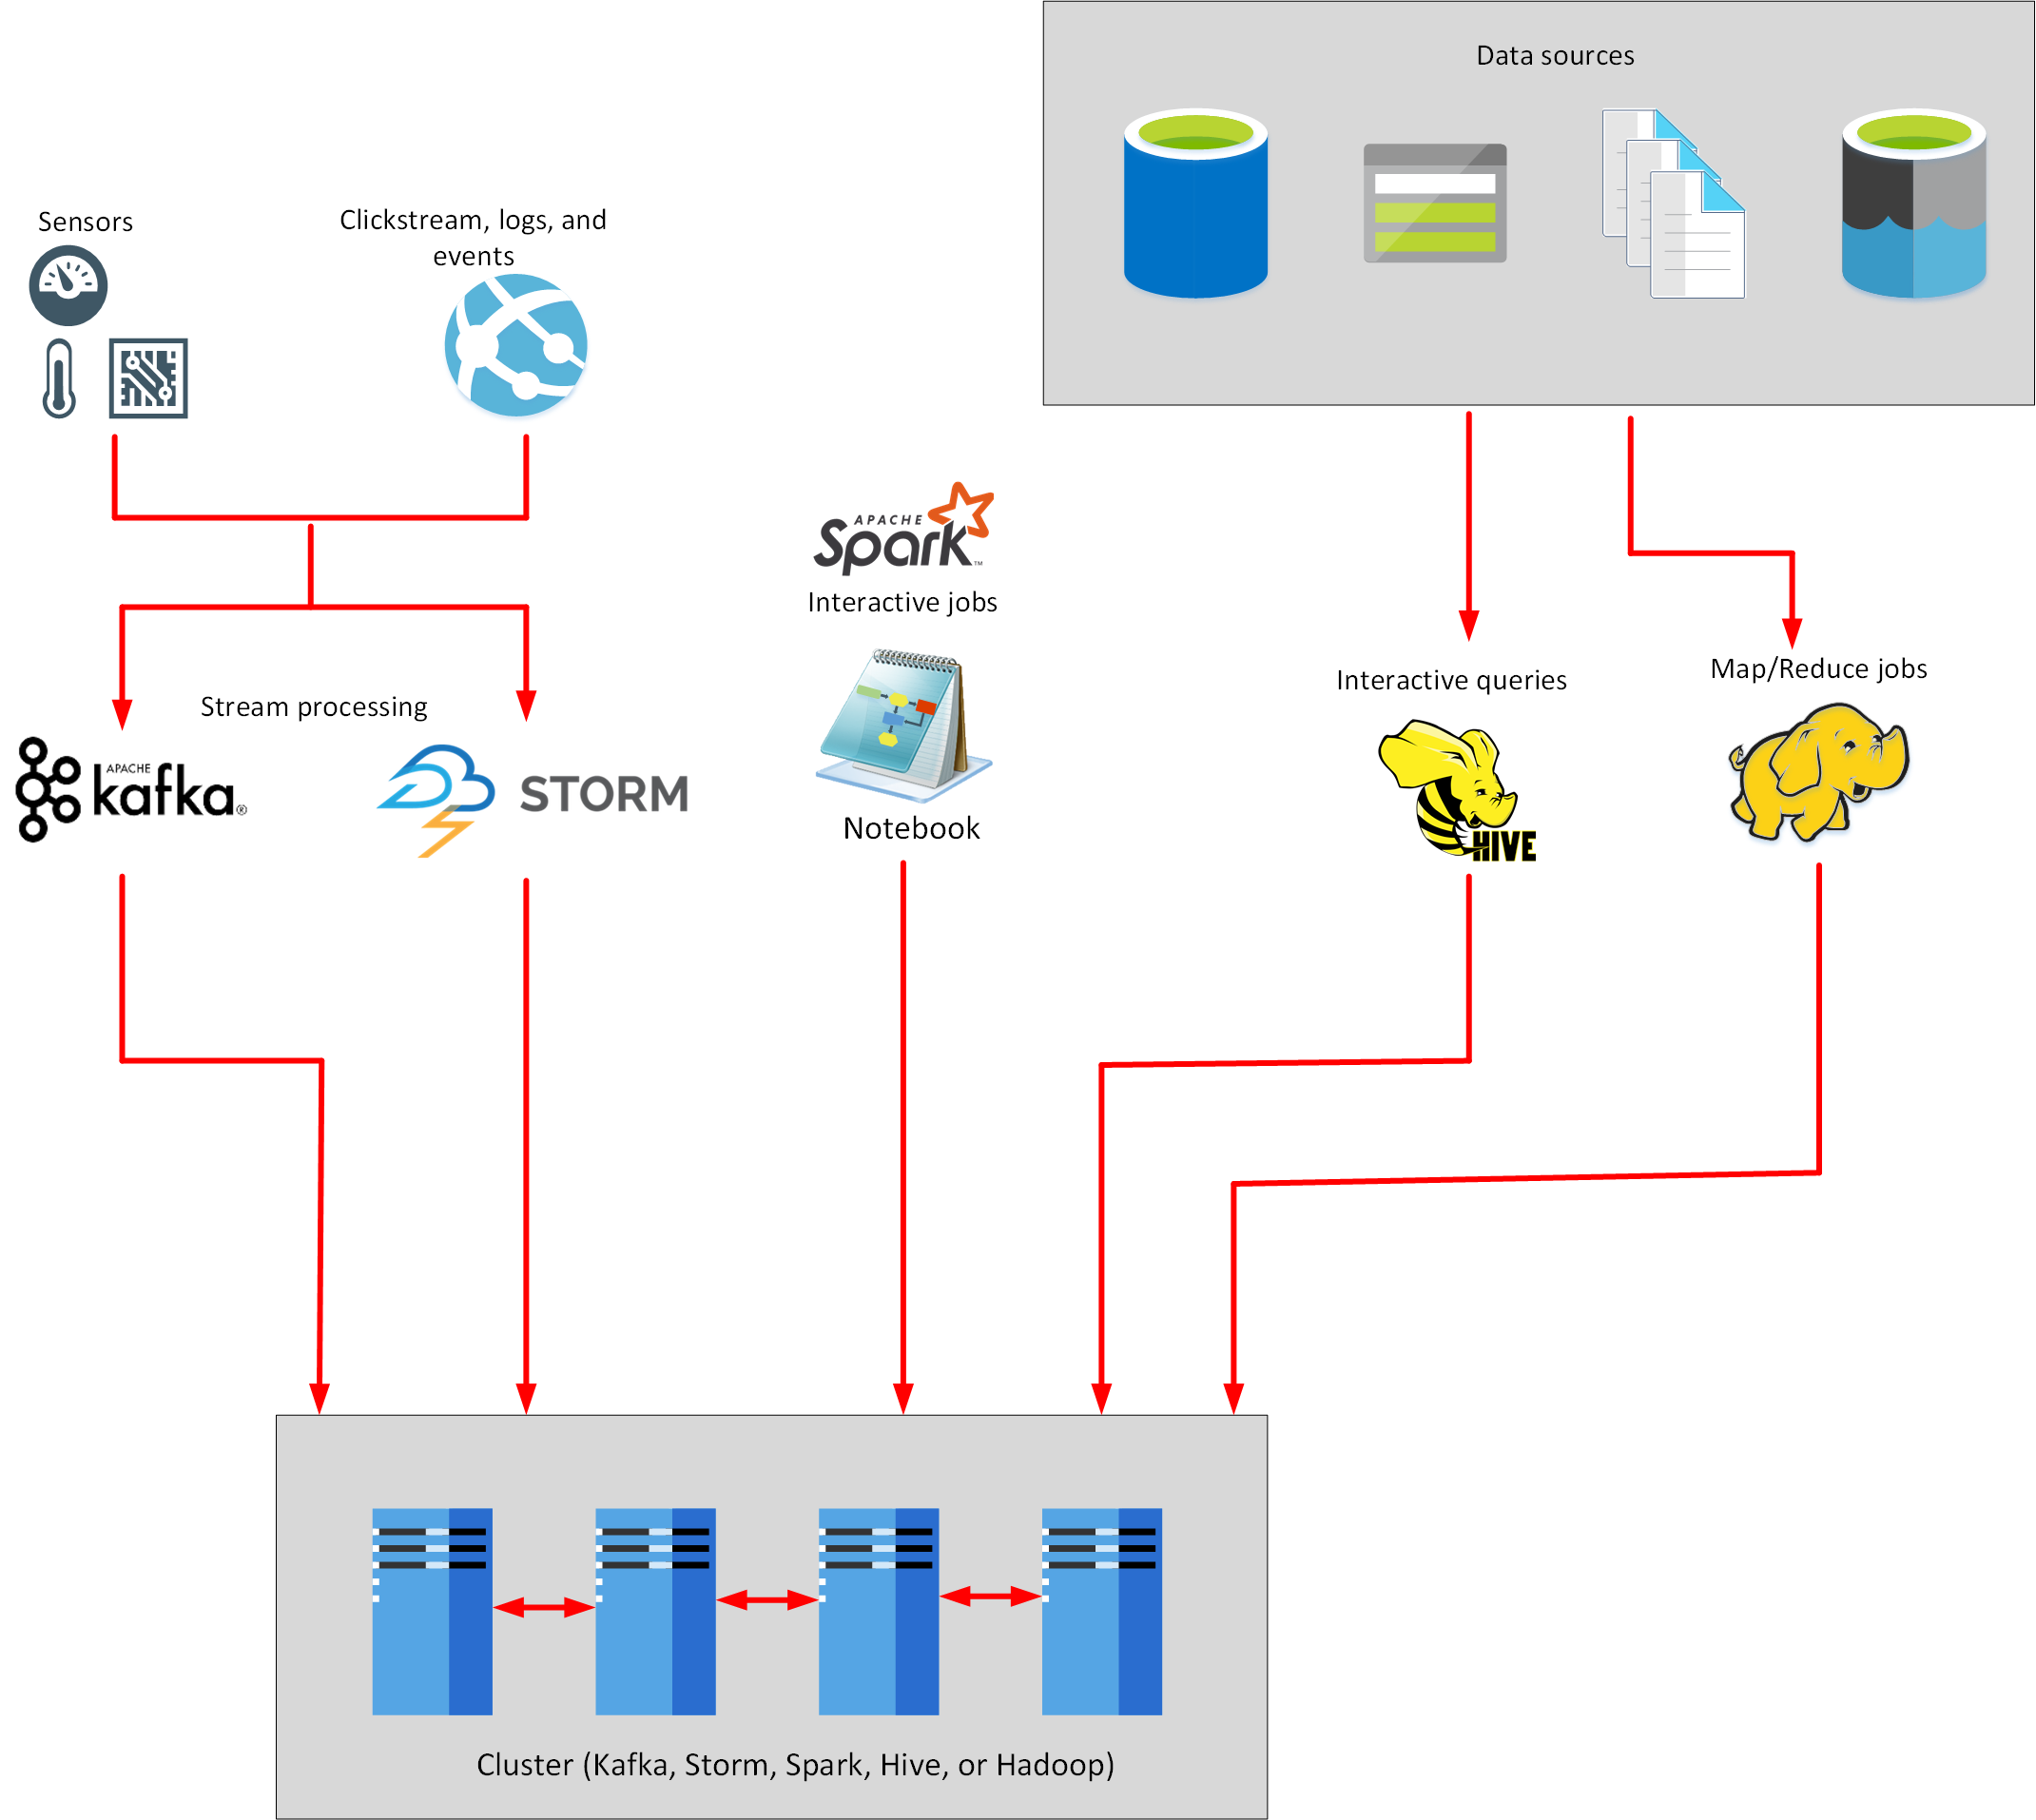
- Apache Hadoop, a collection of open-source tools and utilities that enable you to run processing tasks over large amounts of data.
- HDInsight uses a clustered model, similar to that of Synapse Analytics.
- Hadoop Map/Reduce uses a simple framework to split a task over a large dataset into a series of smaller tasks over subsets of the data that can be run in parallel, and the results then combined.
- Apache Hive provides interactive SQL-like facilities for querying, aggregating, and summarizing data.
- Apache Kafka is a clustered streaming service that can ingest data in real time (Streaming Data).
- Apache Storm is a scalable, fault tolerant platform for running real-time data processing applications. (Streaming data)
Azure Data Factory
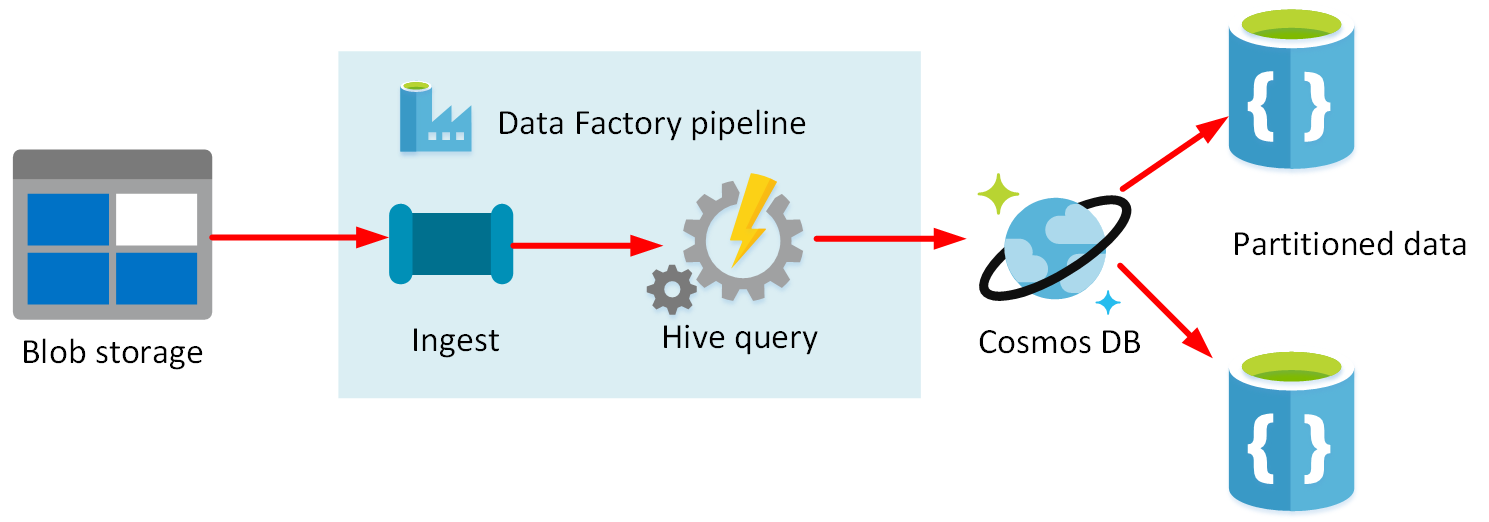
- Data Factory provides a scalable and programmable ingestion engine that you can use to implement complex hybrid extract-transform-load (ETL), extract-load-transform (ELT), and data integration projects.
- Using Azure Data Factory, you can create and schedule data-driven workflows (called pipelines) that can ingest data from the disparate data stores used by the gaming company.
- Build complex ETL processes that transform data visually with data flows or by using compute services such as Azure HDInsight, Azure Databricks, and Azure SQL Database.
- A pipeline is a logical grouping of activities that performs a unit of work.
- Together, the activities in a pipeline perform a task.
### Azure Data Lake
- A file system that can store near limitless quantities of data.
- It uses a hierarchical organization
- Compatible with the Hadoop Distributed File System (HDFS). You can run Hadoop jobs using Azure HDInsight (see below) that can read and write data in Data Lake Store.
- Azure Data Lake Store provides granular security over data, using Access Control Lists.
- Access Control List specifies which accounts can access which files and folders in the store. * Linux -> POSIX-style permissions to grant read, write, and search access based on file ownership and group membership of users.
- Azure Data Factory, Azure Databricks, Azure HDInsight, Azure Data Lake Analytics, and Azure Stream Analytics can read and write Data Lake Store directly.
Data Lake Analytics
- An on-demand analytics job service that you can use to process big data.
- Define a job using a language called U-SQL.
- This is a hybrid language that takes features from both SQL and C#, and provides declarative and procedural capabilities that you can use to process data.
- Understand that the U-SQL code only provides a description of the work to be performed.
- Azure Data Lake Analytics determines how best to actually carry out this work.
- Data Lake Analytics then breaks down this internal representation into stages of execution.
- Each stage performs a task, such as extracting the data from a specified source, dividing the data into partitions, processing the data in each partition, aggregating the results in a partition, and then combining the results from across all partitions.
- Partitioning is used to improve parallelization, and the processing for different partitions is performed concurrently on different processing nodes. The data for each partition is determined by the U-SQL compiler, according to the way in which the job retrieves and processes the data.
- A U-SQL job can output results to a single CSV file, partition the results across multiple files, or can write to other destinations.
- For example, Data Lake Analytics enables you to create custom outputters if you want to save data in a particular format (such as XML or HTML).
- You can also write data to the Data Lake Catalog.
- The catalog provides a SQL-like interface to Data Lake Storage, enabling you to create tables, and views, and run INSERT, UPDATE, and DELETE statements against these tables and views.
Azure Synapse Analytics
- Provides a suite of tools to analyze and process an organization’s data.
- It incorporates SQL technologies, Transact-SQL query capabilities, and open-source Spark tools to enable you to quickly process very large amounts of data.
- Synapse SQL pool: This is a collection of servers running Transact-SQL. Transact-SQL is the dialect of SQL used by Azure SQL Database, and Microsoft SQL Server. You write your data processing logic using Transact-SQL.
- Azure Synapse is composed of the following elements:
- Synapse Spark pool: This is a cluster of servers running Apache Spark to process data. You write your data processing logic using one of the four supported languages: Python, Scala, SQL, and C# (via .NET for Apache Spark). Spark pools support Azure Machine Learning through integration with the SparkML and AzureML packages.
- Synapse Pipelines: A Synapse pipeline is a logical grouping of activities that together perform a task. The activities in a pipeline define actions to perform on your data. For example, you might use a copy activity to transform data from a source dataset to a destination dataset. You could include activities that transform the data as it is transferred, or you might combine data from multiple sources together.
- Synapse Link: This component allows you to connect to Cosmos DB. You can use it to perform near real-time analytics over the operational data stored in a Cosmos DB database.
- Synapse Studio: This is a web user interface that enables data engineers to access all the Synapse Analytics tools. You can use Synapse Studio to create SQL and Spark pools, define and run pipelines, and configure links to external data sources.
- Any data stored in Azure Synapse Analytics can be used to build and train models with Azure Machine Learning.
SQL Pools
- Synapse SQL, your analytics workload runs using a SQL pool.
- In a SQL pool, the Control and Compute nodes in the cluster run a version of Azure SQL Database that supports distributed queries.
- Transact-SQL statements
- T-SQL -> Control Node (Split the work) -> Compute nodes
- The data is split into chunks called distributions.
- A distribution is the basic unit of storage and processing for parallel queries that run on distributed data.
- Each of the smaller queries runs on one of the data distributions.
- The control and compute nodes use the Data Movement Service (DMS) to move data across the nodes as necessary to run queries in parallel and return accurate results.
- Synapse Analytics uses a technology called PolyBase to make external data look like SQL tables.
- Synapse uses Azure Storage to manage your data while it’s being processed.
- By default, an on-demand SQL pool is created in each Azure Synapse Analytics workspace. You can then provision additional pools, either on-demand or provisioned.
- On-demand pools only allow you to query data held in external files. If you want to ingest and load the data into Synapse Analytics, you must create your own SQL pool.
- Designed to run queries over massive datasets.
- You can manually scale the SQL pool up to 60 nodes.
- Pause a SQL pool if you don’t require it for a while. Pausing releases the resources associated with the pool. You aren’t charged for these resources until you manually resume the pool. However, you can’t run any queries until the pool is resumed. Resuming a pool can take several minutes.
-
Use SQL pools in Synapse Analytics for the following scenarios:
-
Complex reporting - You can use the full power of Transact-SQL to run complex SQL statements that summarize and aggregate data.
-
Data ingestion - PolyBase enables you to retrieve data from many external sources and convert it into a tabular format. You can reformat this data and save it as tables and materialized views in Azure Synapse.
- Large amount of data held in files in Azure Data Lake storage. You want to retrieve the data in these files and use it to populate tables held in Azure Synapse Analytics -> Synapse SQL Pools ### Spark pools
- Spark clusters
- Notebooks
- Spark pools and SQL pools can coexist in the same Azure Synapse Analytics instance.
- Notebooks also allow you to visualize data through graphs, and transform data as it’s loaded.
- The data can then be used by Spark Machine Learning (SparkML) and Azure Machine Learning (AzureML)
- Formats -> csv, json, xml, parquet, orc, and avro and many more.
- In-memory cluster computing.
- A Spark job can load and cache data into memory and query it repeatedly. In-memory computing is much faster than disk-based applications.
- Spark pools can have autoscaling enabled,
- Suitable for scenarios:
- Data Engineering/Data Preparation
- Machine Learning -> MLlib
Synapse Pipelines
- A pipeline is a logical grouping of activities that together perform a task.
- A pipeline could contain a set of activities that ingest and clean log data, and then kick off a mapping data flow to analyze the log data.
- The pipeline allows you to manage the activities as a set instead of each one individually.
- Synapse pipelines use the same Data Integration engine used by Azure Data Factory.
Synapse Link
- Azure Synapse Link for Azure Cosmos DB is a cloud-native hybrid transactional and analytical processing (HTAP) capability that enables you to run near real-time analytics over operational data stored in Azure Cosmos DB.
- Synapse link uses a feature of Cosmos DB named Cosmos DB Analytical Store. Cosmos DB Analytical Store contains a copy of the data in a Cosmos DB container, but organized as a column store.
- Column stores are a more optimal format for running analytical workloads that need to aggregate data down a column rather than across a row, such as generating sum totals, averages, maximum or minimum values for a column.
- Cosmos DB automatically keeps the data in its containers synchronized with the copies in the column store.
- Synapse Link enables you to run workloads that retrieve data directly from Cosmos DB and run analytics workloads using Azure Synapse Analytics. The data doesn’t have to go through an ETL (extract, transform, and load) process because the data isn’t copied into Synapse Analytics; it remains in the Cosmos DB analytical store.
- Uses :
- Supply chain analytics and forecasting.
- Operational reporting.
- Batch data integration and orchestration
- Real-time personalization.
- IoT maintenance.
Synapse Studio
- a web interface that enables you to create pools and pipelines interactively.
- Spark notebooks and Transact-SQL jobs
- Monitor the performance of operations that are currently running, and you can manage the serverless or provisioned resources.
Modern Data Warehousing
28 Sep 2021Modern Data Warehouse
- Used as the source for analysis, reporting, and online analytical processing (OLAP).
- Data warehouses have to handle “Big Data”.
- Big data is the term used for large quantities of data collected in escalating volumes, at higher velocities, and in a greater variety of formats.
- Historical (meaning stored) or real time (meaning streamed from the source).
- Modern data warehouse might contain a mixture of relational and non-relational data, including files, social media streams, and Internet of Things (IoT) sensor data.
- Data warehousing solution -> Azure Data Factory, Azure Data Lake Storage, Azure Databricks, Azure Synapse Analytics, and Azure Analysis Services.
- Power BI -> analyze and visualize the data, generating reports, charts, and dashboards.
- Combination of up-to-the-second data, and historical information.
Explore Azure data services for modern data warehousing
Azure Data Factory
- A data integration service.
- Purpose : retrieve data from one or more data sources, and convert it into a format that you process.
- Enables you to extract the interesting data, and discard the rest.
- Azure Data Factory as a pipeline of operations.
- A pipeline can run continuously, as data is received from the various data sources.
Azure Data Lake Storage
- A repository for large quantities of raw data.
- Data lake as a staging point for your ingested data, before it’s massaged and converted into a format suitable for performing analytics.
- A data warehouse also stores large quantities of data, but the data in a warehouse has been processed to convert it into a format for efficient analysis.
- A data lake holds raw data, but a data warehouse holds structured information.
- Azure Data Lake Storage is essentially an extension of Azure Blob storage, organized as a near-infinite file system.
- Charateristics of Data Lake Storage:
- Organizes your files into directories and subdirectories for improved file organization.
- Supports the Portable Operating System Interface (POSIX) file and directory permissions to enable granular Role-Based Access Control (RBAC) on your data.
- Compatible with the Hadoop Distributed File System (HDFS).
Azure Databricks
- Azure Databricks is an Apache Spark environment running on Azure to provide big data processing, streaming, and machine leark consumes large amounts of dataning.
- Apache Spark efficient data processing engine that can consume and process large amounts of data very quickly.
- Spark supports ->R,Python,Scala
- Spark code using notebooks . notebooks contains cells, each contains a seperate block of code.
Azure Synapse Analytics
- An analytics engine
- Azure Synapse Analytics leverages a massively parallel processing (MPP) architecture.
- The Control node is the brain of the architecture.
- The Compute nodes provide the computational power.
- Azure Synapse Analytics supports two computational models: SQL pools and Spark pools.
- In a SQL pool, each compute node uses an Azure SQL Database and Azure Storage to handle a portion of the data.
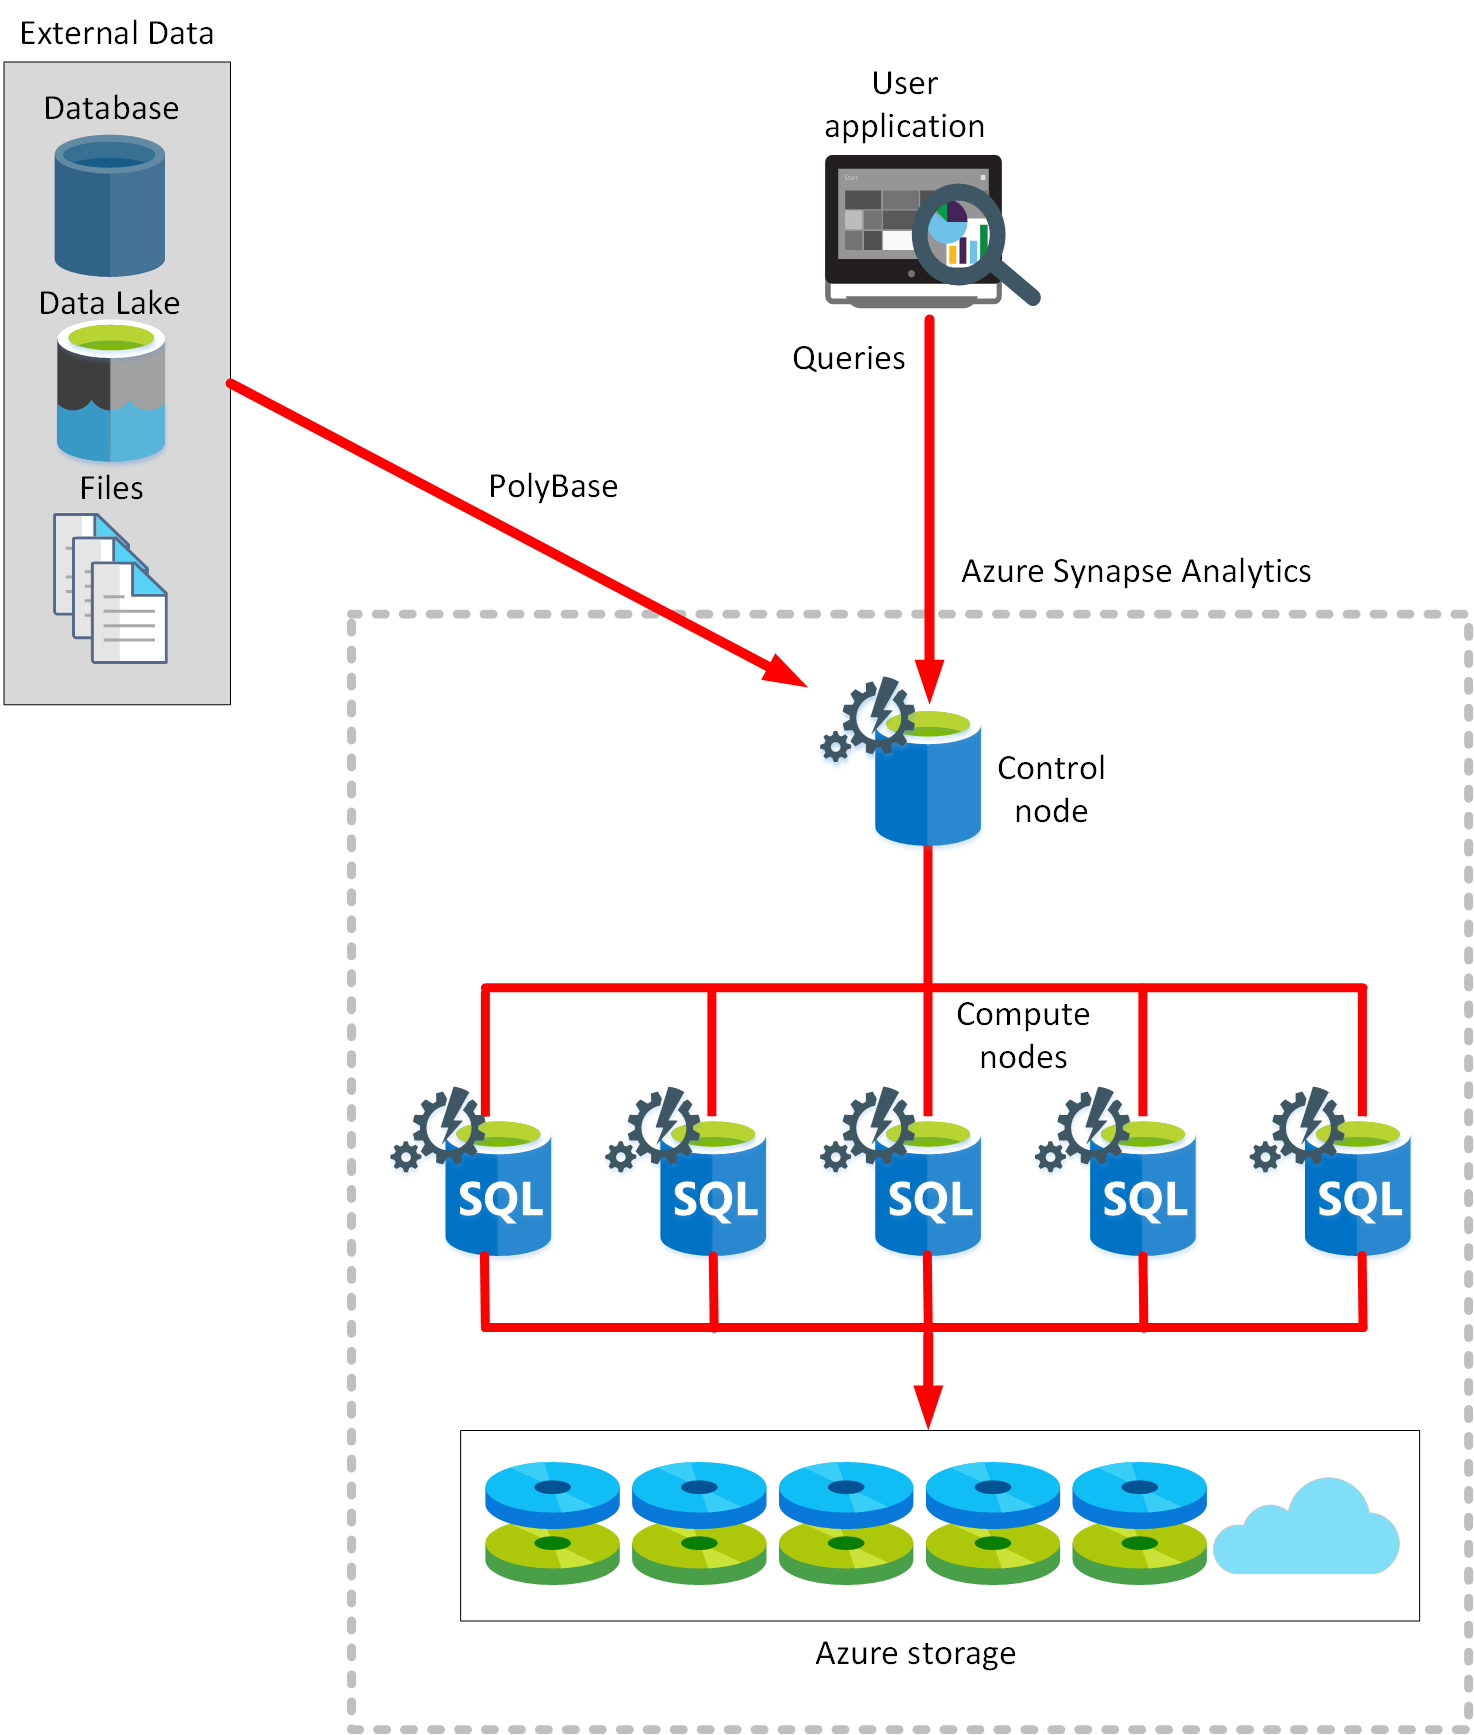
- submit queries -> Transact-SQL statements -> Azure Synapse Analytics runs them
- PolyBase enables you to retrieve data from relational and non-relational sources, such as delimited text files, Azure Blob Storage, and Azure Data Lake Storage.
- You can only scale a SQL pool when it’s not running a Transact-SQL query.
- Spark pool, the nodes are replaced with a Spark cluster
- Spark is optimized for in-memory processing. A Spark job can load and cache data into memory and query it repeatedly. In-memory computing is much faster than disk-based applications, but requires additional memory resources.
- Autoscaling can occur while processing is active.
Azure Analysis Services
- Build tabular models to support online analytical processing (OLAP) queries.
Use Azure Synapse Analytics for:
- Very high volumes of data (multi-terabyte to petabyte sized datasets).
- Very complex queries and aggregations.
- Data mining, and data exploration.
- Complex ETL operations.
- Low to mid concurrency (128 users or fewer).
Use Azure Analysis Services for:
- Smaller volumes of data (a few terabytes).
- Multiple sources that can be correlated.
- High read concurrency (thousands of users).
- Detailed analysis, and drilling into data, using functions in Power BI.
- Rapid dashboard development from tabular data.
Azure HDInsight
- Azure HDInsight is a big data processing service.
- HDInsight implements a clustered model that distributes processing across a set of computers.
- This model is similar to that used by Synapse Analytics, except that the nodes are running the Spark processing engine rather than Azure SQL Database.
- Hadoop is an open source framework that breaks large data processing problems down into smaller chunks and distributes them across a cluster of servers, similar to the way in which Synapse Analytics operates.
- Hive is a SQL-like query facility that you can use with an HDInsight cluster to examine data held in a variety of formats. You can use it to create, load, and query external tables, in a manner similar to PolyBase for Azure Synapse Analytics
